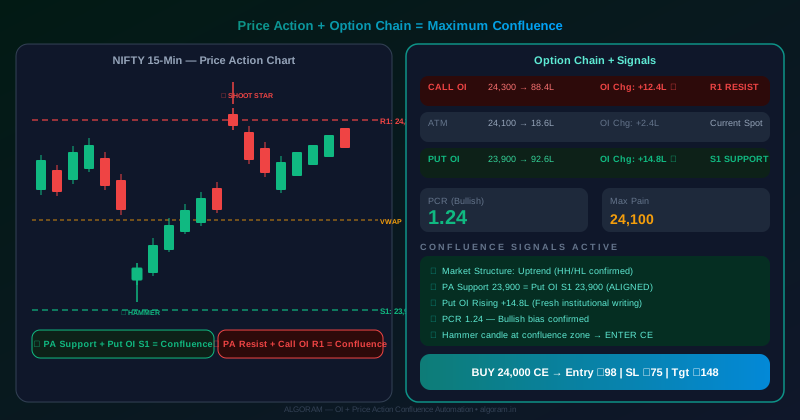
Why Combine Price Action with Option Chain?
Most trading methodologies use either price action analysis or options market data. Very few traders use both simultaneously — which is exactly why the combination provides such a significant edge.
Here's the fundamental problem with each approach used alone:
Price action alone identifies where price has bounced or reversed historically. It tells you where support and resistance were. It can't tell you whether those levels are defended by institutional money right now.
Option chain alone tells you where institutional writers are positioned. It doesn't tell you whether price is approaching those levels in a way that suggests a bounce is likely — versus approaching them in a strong trend that will simply run through them.
When combined, each method's weakness is addressed by the other's strength:
Historical price behaviour at specific zones, candlestick reversal confirmation, trend structure (HH/HL or LH/LL), VWAP relationship, and timing precision for entries.
Current institutional positioning, real-money support (Put OI) and resistance (Call OI), market sentiment bias (PCR), and confirmation that levels are defended by large capital.
Price action support levels frequently fail — price breaks through without warning. No way to know whether the level has institutional backing or is just a coincidence.
OI levels alone give false confidence. Price can approach a Put OI support zone with such momentum that no bounce occurs — only chart structure tells you whether a reversal is probable.
Price Action Fundamentals
Market Structure — The Foundation
Before identifying any setup, determine the current market structure. This is the single most important step in price action analysis.
- Uptrend: Higher Highs (HH) + Higher Lows (HL). Each swing high exceeds the previous. Each pullback low holds above the previous low. Take only long setups — buy at pullbacks to support. Do not short even at resistance (trend typically breaks through).
- Downtrend: Lower Highs (LH) + Lower Lows (LL). Take only short setups — sell at rallies to resistance. Do not buy at support (trend typically breaks it).
- Range: Price oscillating between well-defined support and resistance without sustained trend. Take both directions — buy at support, sell at resistance. Both option chain support and resistance levels are valid.
Key Price Action Levels
- Swing highs/lows: Most recent price reversals on the chart — strongest S/R levels
- Round numbers: Psychological levels (Nifty 24,000; 23,500; 23,000) — magnets for institutional activity
- Prior consolidation zones: Areas where price traded sideways for multiple candles — become strong S/R after breakout
- Gap levels: Gap opens/closes where price jumped — unfilled gaps act as support/resistance
- VWAP: Volume-weighted average price — the most important intraday S/R level (covered in dedicated section below)
Candlestick Confirmation Patterns
Never enter at a price action level on the first touch. Wait for candlestick confirmation — a specific candle pattern that shows price rejection at the level and increasing probability of reversal:
| Bullish Confirmation (at Support) | Pattern Description | Reliability |
|---|---|---|
| Hammer | Small body at top, long lower wick rejecting the support level | High |
| Bullish Engulfing | Large green candle fully engulfs previous red candle at support | Very High |
| Morning Star | 3-candle pattern: red, small doji/inside bar, large green | High |
| Pin Bar | Long wick with small body — price tested and rejected the level | Moderate-High |
| Inside Bar | Current candle within prior candle — consolidation before move | Moderate |
| Bearish Confirmation (at Resistance) | Pattern Description | Reliability |
|---|---|---|
| Shooting Star | Small body at bottom, long upper wick rejecting resistance | High |
| Bearish Engulfing | Large red candle fully engulfs previous green candle at resistance | Very High |
| Evening Star | 3-candle: green, small doji, large red candle | High |
| Doji at Resistance | Indecision candle at resistance — bulls couldn't break through | Moderate |
| Bearish Harami | Small red candle inside prior green candle at resistance | Moderate |
Option Chain — What You're Looking For
For the complete guide to option chain mechanics, read: How to Identify Support and Resistance Using Option Chain
For this combined strategy, the key option chain inputs are:
- Highest Put OI strike: Primary support level. Put writers defend above it. Matches to check against your price action support zone.
- Highest Call OI strike: Primary resistance level. Call writers cap price below it. Check against your price action resistance zone.
- OI Change at key strikes: Rising = fresh institutional conviction (level is strong). Falling = unwinding (level is weakening, don't rely on it).
- PCR: Above 1.2 = only take longs at support. Below 0.8 = only take shorts at resistance. Prevents fighting the institutional trend.
- Max Pain: For expiry day analysis — gravitational pull toward this level as expiry approaches.
The Confluence Framework
The core principle of combining price action with option chain is confluence: the more signals that agree at the same price level, the higher the probability of that level holding (or the breakout being genuine).
Step-by-Step Process
Here is the complete daily workflow for combining price action with option chain analysis:
Pre-Market (8:45 AM)
- Open the daily or hourly chart. Identify current market structure (uptrend, downtrend, range).
- Mark key price action levels: prior swing highs/lows, round numbers, consolidation zones, VWAP previous close.
- Open NSE option chain. Note highest Put OI (S1, S2) and Call OI (R1, R2). Note OI Change direction.
- Compare price action levels with OI levels. Mark any confluence zones — where both align.
- Calculate PCR. Determine today's directional bias.
- Find Max Pain if expiry is within 3 days.
Market Open (9:15–9:30 AM)
- Watch opening 15 minutes to establish the day's VWAP.
- Note the opening price relative to your pre-market confluence levels.
- Is price gapping toward a confluence zone? Or opening within the S1–R1 range?
Trade Identification
- Price approaches a confluence zone (PA level + OI level both present).
- Check OI Change in real-time — is the Put/Call OI at that level rising or falling?
- Watch for candlestick confirmation pattern on your chosen timeframe (15-min for intraday).
- Confirm VWAP is on your side (above VWAP for longs, below for shorts).
- Enter with stop below support or above resistance. Target at next confluence level.
VWAP: The Bridge Between Price Action and Option Chain
VWAP (Volume Weighted Average Price) is the single most important intraday indicator for combining price action with option chain. Here's why: VWAP represents the average price at which all volume has traded on that day, weighted by the amount traded at each price. Institutional traders use VWAP as their benchmark — they aim to buy below VWAP and sell above it.
In combined analysis, VWAP serves as:
- Directional filter: Above VWAP = buyers in control = only take long setups at Put OI support. Below VWAP = sellers in control = only take short setups at Call OI resistance.
- Confluence element: When VWAP aligns with a Put OI support strike AND a price action level, you have triple confluence — extremely high probability setup.
- Trend indicator: If price repeatedly tests VWAP from above and holds, uptrend is intact. If price repeatedly fails to break above VWAP from below, downtrend is strong.
Bullish Setup: Price Action + Option Chain Confluence
Bearish Setup: Price Action + Option Chain Confluence
Breakout Confirmation Using Combined Analysis
Breakout trading is where the combination of price action and option chain is most powerful — and most misused by traders who use only one signal.
What a genuine breakout looks like:
- Price closes above the resistance level on the 15-minute chart with above-average volume
- Call OI at the resistance strike is declining (Call writers covering — they acknowledge the breakout)
- Put OI is now being written at the previously broken resistance strike (former resistance becoming new support)
- PCR rising after the breakout (bullish sentiment increasing)
- Price holds above the breakout level on the first retest (with VWAP moving above the level)
All 5 signals present = very high-conviction long entry on the retest of the breakout level.
Fake Breakout Detection — The Most Valuable Application
The single most profitable application of combined price action + option chain analysis is identifying fake breakouts before being trapped by them.
Price action signal: Price closes above resistance on the chart — looks like a breakout
Option chain signal: Call OI at the resistance strike is STILL RISING (writers are adding more, not covering)
Interpretation: Institutional Call writers are doubling down on their bet that price won't sustain above this level. The breakout is likely a trap — engineered by smart money to trigger buyer stop-losses above resistance before reversing.
Action: Do NOT chase the breakout. Wait for Call OI to decline (confirmation). Or fade the breakout by buying PE near the resistance level with a stop above the false breakout high.
Price action signal: Price closes above resistance with high volume
Option chain signal: Call OI at the resistance strike is DECLINING (Call writers covering their short Call positions)
PCR: Rising after breakout
Interpretation: Institutional writers are acknowledging the breakout — they're closing their resistance positions. This is the real deal.
Action: Buy CE on first pullback to the broken resistance level (now acting as support). Stop below the level. Target at next Call OI resistance.
Nifty Intraday Example: Price Action + Option Chain Confluence
Scenario — Morning (Pre-market analysis):
- Nifty spot: 24,050. Daily chart shows uptrend (HH/HL intact).
- Prior swing low on hourly chart: 23,900 — strong price action support.
- Option chain: Highest Put OI at 23,900 (72 lakh, OI Change +9.8 lakh — fresh writing). Perfect confluence.
- PCR: 1.18 — mildly bullish bias.
- Max Pain: 24,100 — spot below max pain, mild upward pull.
- Plan: If Nifty pulls back to 23,900–23,950 area during the day, look for bullish candle confirmation to buy CE. Target: 24,200–24,300 (R1 Call OI strike). Stop: below 23,870.
Trade execution (11:25 AM):
- Nifty pulls back to 23,920. Forms a hammer candle on the 15-minute chart at exactly the 23,900 confluence zone.
- OI Check: Put OI at 23,900 still rising (+2.2 lakh change since pre-market). Fresh buying.
- VWAP at 24,010 — price is pulling back but VWAP is above, uptrend intact.
- Volume: above average on the hammer formation.
- Entry: Buy Nifty 24,000 CE at ₹98. Stop: ₹75 (below S1 level). Target: ₹148 (R1 area).
- Result: Nifty bounces from 23,920 to 24,180 over 2 hours. Exit CE at ₹146. P&L: +₹4,800 on 10 lots.
Insert screenshot: Nifty 15-min chart showing hammer candle at 23,920 (confluence of PA swing low + Put OI 23,900 strike), with horizontal lines marking S1 (23,900), R1 (24,300), and VWAP. Show entry arrow at hammer close, target at R1.
Bank Nifty Example: Fake Breakout Detection
Scenario: Bank Nifty at 50,800. Pre-market analysis shows:
- Call OI highest at 51,000 (58 lakh, OI Change +6.4 lakh) — resistance at 51,000.
- Price action: Prior swing high at 51,050 — price action resistance also at this zone.
- PCR: 0.82 — slightly bearish.
11:45 AM: Bank Nifty surges to 51,060, closing above the 51,000 resistance on the 15-minute chart. Looks like a breakout. Most traders buy CE.
Option chain check: Call OI at 51,000 strike is now 62 lakh — INCREASED by 4 lakh since price crossed it. Call writers are adding positions, not covering. This is a fake breakout.
Action: Do not chase the breakout. Instead, observe. Within 25 minutes, Bank Nifty reverses from 51,060 back below 51,000, trapping all the buyers who entered on the "breakout." Option chain confirmed what price alone couldn't show.
Intraday Strategy: Complete Daily Workflow
Morning Setup (8:45–9:10 AM)
- Daily chart: Is market in uptrend, downtrend, or range? Which levels are significant?
- Hourly chart: Find the 2–3 most recent swing highs and lows within 500 points of current price.
- Option chain: Note S1 (highest Put OI) and R1 (highest Call OI). Calculate PCR.
- Identify confluence: Do PA levels and OI levels align at any price zone? Mark these as your trading zones.
- Set price alerts at confluence zones so you don't need to stare at charts all morning.
Execution (9:15 AM onwards)
- When price approaches a confluence zone, switch to 15-minute chart.
- Wait for candlestick confirmation pattern before acting.
- Check OI Change in real-time (refresh every 5 min near key levels).
- VWAP filter: only take longs if VWAP is above the level or approaching from above.
- Enter, set stop and target, and step away. Let the trade work.
Swing Trading: 3–10 Day Positions
For swing trading, use the daily chart for market structure and levels, and the monthly expiry option chain (more stable OI concentrations than weekly).
Key swing trading rule: The highest Put OI on the monthly expiry is the monthly support floor. The highest Call OI is the monthly ceiling. As long as both remain intact (OI is rising, not unwinding), the range is valid.
Look for daily chart candlestick confirmations at the confluence zones of monthly OI levels + daily price action support/resistance. Hold for 3–7 days targeting the opposite OI level. Use 3-day ATR as stop size.
Expiry Day: Special Rules
Expiry day (Thursday for Bank Nifty, last Thursday of month for Nifty) has unique dynamics:
- Max Pain dominates: In the last 2 hours before close, price gravitates toward Max Pain strike regardless of price action patterns.
- Gamma acceleration: ATM options move dramatically — standard price action rules apply but with much wider volatility ranges. Be very cautious with stop sizes.
- OI unwinding: Losing writers close positions rapidly on expiry day — OI can fall quickly even for strong-looking levels. Don't trust OI support/resistance as firmly on expiry day as on other days.
- Combined rule: Only trade expiry day confluence setups where: Max Pain + PA level + OI level are all at the same zone. Single-signal trades are too risky on expiry.
Comparison Tables
Price Action Alone vs Combined Analysis
| Factor | Price Action Alone | PA + Option Chain Combined |
|---|---|---|
| Signal source | Historical price data | Historical + current institutional data |
| False breakout rate | High (no institutional confirmation) | Much lower (OI unwinding required) |
| Support reliability | Moderate (was defended before) | High (currently defended by Put writers) |
| Breakout confirmation | Volume + close outside level | Volume + close + Call OI declining |
| Win rate (estimate) | ~48–55% | ~58–68% with full confluence |
| Market sentiment | Not visible | PCR provides real-time sentiment |
| Institutional activity | Inferred only | Directly visible via OI |
| Complexity | Simple | Moderate (2 data sources) |
| Time requirement | Lower | 15–20 min additional pre-market |
Bullish vs Bearish Confluence Signals
| Factor | Bullish Confluence | Bearish Confluence |
|---|---|---|
| Market structure | Uptrend (HH/HL) | Downtrend (LH/LL) |
| PCR | Above 1.0 (Put-heavy) | Below 1.0 (Call-heavy) |
| VWAP position | Price above VWAP | Price below VWAP |
| Key OI level | High Put OI at price level | High Call OI at price level |
| OI Change | Rising Put OI (fresh writing) | Rising Call OI (fresh writing) |
| Candlestick | Hammer, Bullish Engulfing | Shooting Star, Bearish Engulfing |
| Volume | High on bullish candle | High on bearish candle |
| Trade action | Buy CE, target R1 | Buy PE, target S1 |
Common Mistakes in Combined Analysis
- Entering on the first touch of a confluence zone without candle confirmation. The most common mistake. A level's presence in both PA and OI is necessary but not sufficient. Wait for the candle.
- Ignoring PCR direction when taking trades. Taking long CE positions when PCR is below 0.8 (bearish) means fighting the institutional trend. Even at support, the probability drops significantly when market sentiment is bearish.
- Using weekly OI for swing trades. Weekly OI shifts rapidly. For positions held 3+ days, monthly OI is far more stable and reliable.
- Forgetting that OI levels shift daily. A 23,900 Put OI level that was strongest yesterday may have shifted to 24,000 today as OI rolled. Always refresh your option chain before market open.
- Chasing breakouts when OI says they're fake. The most expensive mistake. When price breaks out but OI doesn't confirm, waiting 5–10 minutes almost always shows the trap.
- Overconfidence in confluence. Even 5/5 signal confluence fails sometimes. Always maintain defined risk (stop-loss) regardless of setup quality.
Combined Analysis Trade Entry Checklist
Automating This Combined Strategy
The combined price action + option chain analysis workflow involves significant data processing — refreshing option chain every 15–30 minutes, monitoring OI Change at multiple strikes, checking VWAP in real-time, and watching for candlestick confirmations simultaneously. For most traders, managing all of this manually while also monitoring open positions is the primary execution bottleneck.
ALGORAM's platform integrates these signals into automated rule-based strategies. The OI & Volume-Based Signals layer evaluates Put OI, Call OI, and OI Change automatically before any entry. The platform can be configured to require both a price-action-based condition (VWAP breakout, EMA cross, price at defined level) AND an OI confirmation condition (Put OI at support rising, Call OI at resistance declining) before executing any trade.
The practical result: a strategy that only enters when multiple confluence conditions are simultaneously met — which is exactly what this combined analysis methodology requires. Without automation, monitoring all these conditions simultaneously is difficult. With ALGORAM's no-code platform, you define the confluence rules once and the system evaluates them on every potential signal.
For traders who want to apply this combined methodology systematically: How No-Code Algo Trading Helps Options Traders and Option Chain Support & Resistance Complete Guide
📊 Automate Your Price Action + OI Confluence Strategy
ALGORAM auto-evaluates OI confirmation, VWAP, and price action signals simultaneously. 7-day free demo on real NSE data.
🚀 Launch Offer — First 100 Customers
Conclusion
The combination of price action and option chain analysis creates a more complete picture of market dynamics than either method alone. Price action tells you what price has done and where it's likely to react. Option chain tells you where institutional money is positioned right now. When both say the same thing about the same price level, you have a genuinely high-probability setup.
The mechanics are straightforward. The discipline is harder — waiting for full confluence, not entering on partial signals, and maintaining defined risk even when conviction is high. This is where automation provides its most sustainable edge: enforcing the confluence rules consistently, executing at signal speeds, and never deviating due to impatience or FOMO.
Apply this framework consistently over 100+ trades and the improvement in win rate relative to price action alone will be measurable.
Master option chain: → Option Chain S&R Guide
Automate the strategy: → ALGORAM 7-day free demo
Options automation: → No-Code Algo Trading for Options Traders
Best offer: → Open 5paisa for 3 months free access
Avoid mistakes: → Top 10 Trading Mistakes Guide
Frequently Asked Questions

Ankit developed the combined price action + option chain analysis framework over 12+ years of Nifty and Bank Nifty options trading. He built ALGORAM's OI Signal layer specifically to automate the OI confirmation step — which requires real-time data evaluation that most traders cannot consistently perform manually during active trading sessions.