Introduction
Most retail traders watch price charts. They study candlestick patterns, draw support and resistance lines, and apply indicators like RSI and MACD. All of this is useful — but it misses the biggest variable in NIFTY's direction: who is actually buying and selling.
The Indian stock market is dominated by institutional participants. Foreign Institutional Investors (FIIs) and Domestic Institutional Investors (DIIs) collectively account for the majority of NIFTY's directional moves. When FIIs aggressively buy large-cap Indian equities, NIFTY rises. When they sell, it falls. When DIIs step in with their SIP-driven buying, they cushion the falls. Understanding this institutional flow is one of the most underutilised edges available to retail traders.
This guide explains who FIIs and DIIs are, how their capital flows move NIFTY, how to track and interpret their data, and how to incorporate it into systematic trading strategies.
Who Are FIIs? (Foreign Institutional Investors)
FIIs are overseas entities registered with SEBI to invest in Indian securities. They include:
- Global mutual funds — BlackRock, Vanguard, Fidelity and similar asset managers investing Indian exposure funds
- Hedge funds — Global macro funds, long-short equity funds, and quant funds
- Sovereign wealth funds — Norway's Government Pension Fund, Singapore's GIC, Abu Dhabi Investment Authority
- Pension funds — Large global pension allocators such as CalPERS, Ontario Teachers, and Japanese pension funds
- Insurance companies — Global insurers with equity allocation mandates
FIIs invest in India based on: India's GDP growth outlook relative to other emerging markets, currency (Rupee vs Dollar) expectations, global risk appetite (risk-on vs risk-off), interest rate differentials, and India-specific events (Budget, RBI policy, elections).
When global risk appetite improves (US markets rally, VIX falls), capital flows to emerging markets including India — FIIs buy. When risk-off events occur (US recession fears, geopolitical tensions, strong Dollar), FIIs repatriate capital — selling Indian equities and pulling capital back to US treasuries or their home markets.
Who Are DIIs? (Domestic Institutional Investors)
DIIs are Indian entities investing in domestic markets:
- Indian mutual funds — HDFC Mutual Fund, SBI Mutual Fund, ICICI Prudential, Nippon, Mirae — by far the largest DII category
- Insurance companies — LIC (the dominant player), HDFC Life, SBI Life — mandatory equity allocation for unit-linked policies
- Banks' proprietary trading — Banks trading their treasury portfolios
- National Pension System (NPS) — Mandatory equity portion of government and corporate employee pension accounts
The key structural feature of DIIs: they receive consistent daily inflows from SIPs (Systematic Investment Plans) — Indian retail investors investing fixed monthly amounts regardless of market conditions. This gives DIIs forced buying power even during market corrections, which is why DII buying typically accelerates when FIIs sell (mutual funds deploy fresh SIP inflows into cheaper market prices).
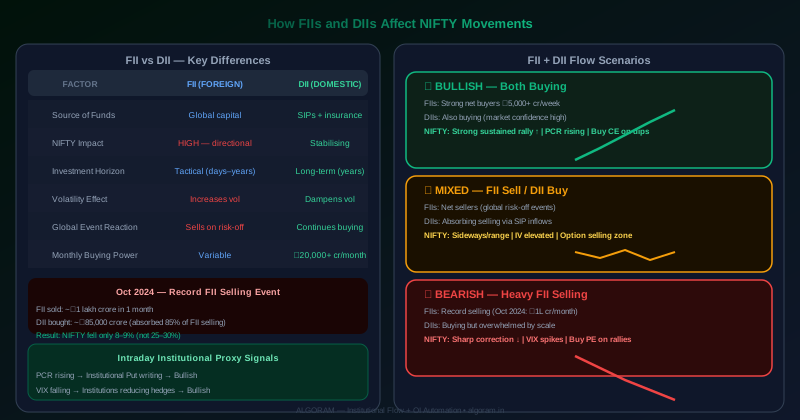
FII vs DII: Key Differences
| Factor | FIIs (Foreign) | DIIs (Domestic) |
|---|---|---|
| Source of Funds | Global capital markets, foreign currencies | Indian SIPs, insurance premiums, pension contributions |
| Investment Objective | Emerging market returns, alpha generation | Long-term wealth creation, liability matching |
| Investment Horizon | Varies — days to years, often tactical | Long-term (months to decades) |
| NIFTY Impact | Large, directional, fast-moving | Stabilizing, counter-cyclical |
| Volatility Influence | High — large sudden flows create spikes | Dampening — consistent buying reduces drawdowns |
| Reaction to Global Events | Strong — sell India on global risk-off | Weak — continue buying (SIP flows don't stop) |
| India-specific Sensitivity | High — react to India macro, elections, policy | Moderate — primarily follow Indian SIP investor behavior |
| Currency Risk | Yes — Dollar/Rupee affects returns | No — invest in INR, no currency conversion |
Why FIIs Have a Bigger NIFTY Impact
FIIs collectively hold a significant portion of the free-float market capitalisation of NIFTY 50 constituents. In HDFC Bank, Infosys, TCS, Reliance, and other Nifty heavyweights, FII ownership frequently exceeds 30–40% of free-float shares. When these institutions buy or sell in large quantities, they directly move the prices of index components — which cascades into NIFTY index moves.
Illustrative rally example: In late 2023, FIIs net bought approximately ₹80,000+ crore in Indian equities over a single quarter. This sustained buying drove NIFTY from approximately 19,200 to 21,000 — a 9% rally — with minimal fundamental change in Indian corporate earnings. The catalyst was global capital allocation to India as a China+1 beneficiary.
Illustrative correction example: In October 2024, FIIs sold approximately ₹1 lakh crore in a month (record selling). NIFTY fell from ~26,200 to under 24,000 in 6 weeks — despite Indian economic fundamentals remaining solid. The selling was driven by global factors: strong US Dollar, US election positioning, and risk rotation toward US assets.
These examples illustrate the core insight: NIFTY's short-to-medium term direction is heavily influenced by FII capital allocation decisions that have little to do with India's domestic economy.
How DII Buying Supports the Market
The structural DII buying from SIP flows has become increasingly significant. Indian mutual funds received approximately ₹20,000–25,000 crore monthly in SIP contributions through 2024–25. This means that every month, domestic fund managers have fresh capital to deploy — and they typically deploy it into exactly the NIFTY stocks that FIIs are selling.
This creates the characteristic "FII selling / DII buying" counterbalance that has defined Indian markets for the past 5+ years. During the FII October 2024 selling event described above, DIIs net bought approximately ₹85,000+ crore in the same period — absorbing more than 80% of FII selling. The result: instead of a 25–30% correction that heavy FII selling might have caused in prior years, the market fell approximately 8–9% before recovering.
DII support is strongest when: SIP flows are accelerating (more fresh retail money entering), market has corrected significantly (fund managers see value), and specific sectors are underowned by domestic institutions.
How FII + DII Combine to Affect NIFTY
- FIIs: Strong net buyers
- DIIs: Also buying (bull market momentum)
- Result: Strong sustained rally
- NIFTY: Trending strongly upward
- Options: PCR rising, Put OI building
- Action: Buy CE on dips to VWAP support
- FIIs: Net sellers (global risk-off)
- DIIs: Net buyers (SIP inflows + value buying)
- Result: Sideways or mild decline
- NIFTY: Choppy, range-bound
- Options: Elevated IV, higher straddle value
- Action: Option selling in range; avoid directional bets
- FIIs: Heavy net sellers (large outflows)
- DIIs: Buying but overwhelmed
- Result: Sharp correction
- NIFTY: Strongly declining
- Options: VIX spikes, Put premiums surge
- Action: Buy PE on rallies; tighten stops on longs
Where to Track FII and DII Data
All FII/DII data is public and free:
- NSE India: nseindia.com/reports/fii-dii — Daily, updated by 7:00 PM IST after market close
- NSDL FPI Tracker: nsdl.co.in — Monthly and weekly FPI (FII) investment trends with sector breakdown
- Moneycontrol / Economic Times Markets: Show daily net figures prominently in market data sections
- BSE India: bseindia.com — Institutional trading statistics
How to interpret the data: Focus on net buying/selling (buys minus sells), not gross figures. Look at 5-day and 20-day rolling trends rather than single-day readings. A single large FII buying day can be noise; 5+ consecutive days of net buying suggests a genuine trend change.
Since daily FII/DII data only comes after close, intraday traders use proxies: Option chain PCR changes (PCR rising = institutional Put writing = bullish), India VIX movement (VIX falling during the day = institutions reducing hedges = bullish), and Nifty futures premium vs spot (premium expanding = institutional buying in futures). These are real-time institutional sentiment signals available during market hours.
How FIIs Affect NIFTY Options
FII institutional activity shows up in NIFTY options data in specific, identifiable ways:
- Heavy FII buying → Put writing by institutions: When FIIs accumulate equity, they often sell index Puts as income/hedging strategy, adding to Put OI. PCR rises. This is a bullish signal for option buyers.
- FII selling → Put buying / Call selling: FIIs hedge their equity portfolios by buying Puts when selling. Put OI rises, Call OI rises at resistance. IV expands. VIX rises. This creates option premium expansion — good for option sellers if the move is expected to be range-bound.
- Sustained FII selling → IV spike: Multi-day FII selling creates sustained VIX spikes (India VIX rising from 13 to 18+ during heavy FII outflow months). All option premiums become expensive.
- FII buying revival after correction: When FIIs re-enter after a correction, IV collapses rapidly (VIX falls), creating IV crush for option holders — but option sellers profit from the premium collapse.
For the complete option chain analysis framework: How to Identify Support and Resistance Using Option Chain
Using FII and DII Data in Trading
Trend Confirmation
If FIIs have been net buyers for 5+ consecutive days and price action is making HH/HL (higher highs and higher lows), you have institutional + price action trend confirmation. These are the highest-probability long setups — trade in the direction of both institutional flow and price structure.
Swing Trading
FII/DII data is most directly applicable to swing trades (3–10 days). A swing long thesis: FIIs net bought ₹5,000+ crore in the last week + NIFTY broke above a key resistance on volume + PCR rose above 1.2. This triple confluence (institutional buying + price breakout + option chain sentiment) creates very high conviction swing entries.
Intraday Trading
Use previous day's FII/DII data as a directional bias filter for the next day. FII net buyers yesterday → look for long setups today at VWAP support. FII net sellers yesterday → be cautious with long positions, look for short setups at resistance. Combine with morning option chain OI for the day's specific S/R levels.
Sector Rotation
NSDL's sectoral FII data shows which sectors FIIs are buying (IT, Financials, Pharma, Consumer) and which they're selling. Sector-specific FII buying creates rotational opportunities — stocks in sectors with heavy FII buying outperform even in flat markets.
Common Mistakes Traders Make with FII/DII Data
- Trading on single-day FII data without trend context. One day's FII buying of ₹1,000 crore in an overall downtrend is noise, not reversal. Look at 5–10 day rolling trends.
- Ignoring DII participation. FII selling + DII buying = different scenario from FII selling + DII also selling. Always check both together.
- Assuming FII buying = immediate NIFTY rally. FII buying concentrated in specific sectors (small-cap IT, Pharma) may not move the Nifty 50 much if those sectors are underrepresented in the index.
- Not combining with price action. Institutional flows provide direction bias — price action provides entry timing. Using FII data without waiting for price action confirmation leads to premature entries.
- Treating F&O FII data as equivalent to cash market data. FII F&O activity includes hedging — FIIs can be net sellers in futures while being net buyers in cash. Cash market data is the primary signal.
- Overreacting to single-session headlines. "FII sold ₹3,000 crore" on one day in a strong bull market is typically noise. Multiple consecutive sessions of heavy selling is the signal.
Combining FII/DII Data with Technical Analysis
The most effective FII/DII-based trading approach combines institutional data with technical confirmation. Here's the framework:
When all five elements align, you have a trade backed by institutional capital flow, technical market structure, real-time options positioning, price confirmation, and volume support. Related guides: How to Combine Price Action with Option Chain Analysis
How Algorithmic Trading Uses Institutional Data
The challenge with manually incorporating FII/DII data into trading is consistency. Manually checking yesterday's FII data, overlaying it with today's option chain, waiting for price action confirmation, and executing at the right moment — all under live market pressure — is error-prone. Emotional override happens.
ALGORAM's no-code platform allows traders to build rule-based strategies that systematically incorporate these signals. The strategy logic might read: "If 5-day FII net activity is positive AND Nifty is above VWAP AND Put OI at S1 is rising, enter CE on first bullish candle at S1 level." This entire multi-condition rule executes automatically — no manual data-checking, no emotional decision under pressure.
Platform features that support institutional data-driven automation:
- OI & Volume-Based Signals: Automatically evaluates option chain OI alignment before any entry — the real-time institutional proxy signal during market hours
- PCR Filter: Configure trades to only execute when PCR is above/below defined thresholds — ensuring institutional sentiment alignment
- Multi-condition entry rules: Combine FII-trend-proxies (PCR, IV direction, OI buildup) with price action triggers
- Backtesting: Test how FII-trend-filtered strategies would have performed across different institutional flow regimes (heavy buying periods, mixed periods, selling panics)
Read: How No-Code Algo Trading Helps Options Traders and Top Benefits of No-Code Algo Trading Platforms
🏢 Trade with Institutional Flow Intelligence
ALGORAM combines option chain OI, PCR, and price action into automated rule-based strategies. 7-day free demo on real NSE data.
🚀 Launch Offer — First 100 Customers
Conclusion
FIIs and DIIs are the dominant forces shaping NIFTY's direction. FIIs bring large, directional capital flows that create momentum — both upward during risk-on periods and downward during risk-off events. DIIs provide structural support through consistent SIP-driven buying that cushions corrections and absorbs FII selling.
Understanding this institutional dynamic transforms how you interpret NIFTY movements. A chart pattern that looks like a strong breakout during FII selling is far less reliable than the same pattern during FII accumulation. A support level defended by both price action and institutional Put writing is far stronger than one supported by price action alone.
The traders who incorporate institutional flow analysis into their decision-making — confirming with price action, option chain, and technical indicators — make more informed decisions than those reacting to charts alone. And the traders who automate this multi-input analysis execute it consistently, without the emotional override that defeats most manual approaches.
Track daily: → NSE FII/DII data (free, after close)
Combine with option chain: → Option Chain S&R Guide
Price action framework: → Price Action + Option Chain Analysis
Automate the strategy: → ALGORAM 7-day free demo
Best offer: → Open 5paisa for 3 months free
Frequently Asked Questions

Ankit has tracked FII/DII flows for 15+ years alongside technical analysis. His view: "Indian retail traders spend 90% of their analysis time on indicators and 10% on institutional flows — but institutional flows drive 70% of NIFTY's direction. Getting that ratio right changes everything." ALGORAM's OI signal layer was built to bring institutional data into automated execution.