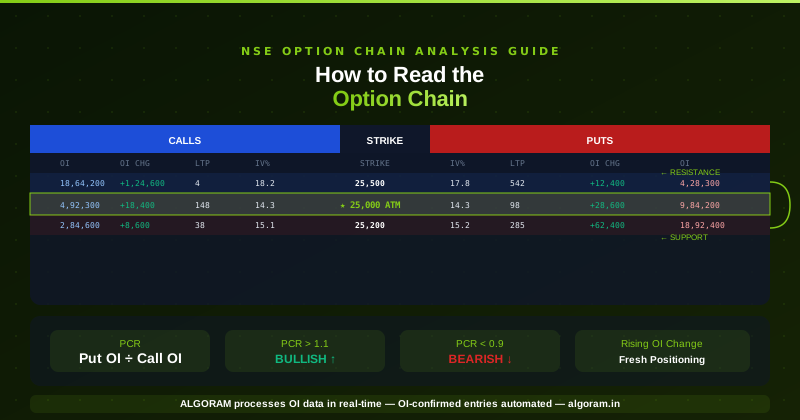
What is an Option Chain?
The option chain is a real-time matrix published by NSE showing every available option contract for a given underlying (NIFTY 50, Bank Nifty, or individual stocks) across all strike prices and expiry dates. It's the most transparent and complete view of institutional options positioning available to any market participant — retail or institutional, free of charge on the NSE website.
Understanding the option chain gives you something most retail traders never have: insight into where the large money is positioned. Option sellers (who write the most OI) are predominantly institutions with deep analysis and market-making capabilities. Their positioning, visible in the option chain, reveals the levels they're defending — and those become your most reliable support and resistance zones for the day.
This guide walks you through every column, every metric, and every practical trading application — with real NIFTY examples throughout. Related: How to Identify S/R Using Option Chain
How to Access the NSE Option Chain
- Go to nseindia.com (NSE India's official website)
- Click Market Data in the top navigation
- Select Derivatives → Option Chain
- Select underlying: NIFTY 50 (or BANKNIFTY for Bank Nifty)
- Select Expiry Date — current week or nearest monthly expiry
- The chain refreshes every 30 seconds during market hours
The option chain shows a symmetrical table: Call options on the left side, Put options on the right side, with strike prices in the centre column. The ATM strike (closest to current NIFTY price) is highlighted — typically in yellow on NSE's display.
Understanding Every Column — The Complete Guide
| Column | What It Shows | How to Use It |
|---|---|---|
| OI (Open Interest) | Total outstanding contracts at this strike | Identifies key support (Put) and resistance (Call) levels |
| Change in OI | Contracts added or removed since previous close | Most important column — shows fresh positioning |
| Volume | Contracts traded today | Identifies liquid strikes — avoid illiquid strikes |
| IV (Implied Volatility) | Market's expected volatility for that strike | High IV = expensive; low IV = cheap. Compare to historical |
| LTP (Last Traded Price) | Most recent premium price | The actual cost to buy or income to sell at this strike |
| Net Change | Premium change from previous close | Shows which strikes are gaining/losing premium fastest |
| Bid / Ask | Current buy/sell spread | Wide spread = illiquid; narrow spread = liquid. Trade liquid |
| Strike Price | The exercise price of the option | Centre column — the reference point for all analysis |
Reading a Real Option Chain — Step-by-Step Example
Let's walk through a simplified NIFTY option chain when NIFTY is trading at 25,050:
| CALLS | STRIKE | PUTS | ||||||
|---|---|---|---|---|---|---|---|---|
| OI | OI Chg | LTP | IV | STRIKE | IV | LTP | OI Chg | OI |
| 8,42,450 | +34,200 | 512 | 15.2 | 24,800 | 13.8 | 18 | -12,400 | 2,18,600 |
| 6,28,100 | +22,800 | 315 | 14.8 | 24,900 | 13.2 | 32 | -8,200 | 3,42,200 |
| 4,92,300 | +18,400 | 148 | 14.3 | 25,000 ★ATM | 14.3 | 98 | +28,600 | 9,84,200 |
| 3,18,400 | +14,200 | 72 | 14.6 | 25,100 | 14.8 | 178 | +42,800 | 12,64,800 |
| 2,84,600 | +8,600 | 38 | 15.1 | 25,200 | 15.2 | 285 | +62,400 | 18,92,400 |
| 14,28,400 | +82,400 | 12 | 16.8 | 25,400 | 16.5 | 415 | +18,200 | 6,42,100 |
| 18,64,200 | +124,600 | 4 | 18.2 | 25,500 | 17.8 | 542 | +12,400 | 4,28,300 |
What This Option Chain Tells Us
- Primary Resistance: 25,500 — highest Call OI (18,64,200) with strongest fresh writing (+1,24,600 OI Change). Call writers strongly defending this level.
- Secondary Resistance: 25,400 — second highest Call OI (14,28,400), also seeing fresh writing. Two layers of resistance above.
- Primary Support: 25,200 — highest Put OI (18,92,400) with strong fresh writing (+62,400). Put writers defending aggressively.
- PCR at ATM: Put OI at 25,000 (9,84,200) ÷ Call OI at 25,000 (4,92,300) = 2.0 — extremely bullish at ATM strike. Put writers overwhelmingly dominant.
- OI Change pattern: Put OI increasing significantly at 25,200 and 25,100 (below current price) while Call OI increasing at 25,400 and 25,500 (above). Market expects NIFTY to stay in 25,000–25,500 range today.
- Trade implication: Buy CE on dips toward 25,200 support; target 25,400. Avoid buying PE — institutional Put writing is overwhelmingly bullish. Alternatively, sell straddle at 25,000 ATM if VIX is low.
Open Interest — The Foundation
Open Interest is the total count of option contracts at a given strike that remain open (not expired or settled). For a contract to exist in OI, one party wrote it (seller) and one party holds it (buyer). The seller's position creates the key market dynamic: they will actively defend their strike to prevent the option from moving into the money — because that's when they have to pay out.
This defensive behavior is what creates option chain-based support and resistance. A Put seller at 25,000 doesn't want NIFTY to fall below 25,000 — they're incentivized to buy underlying or Buy CE to defend that level. The higher the OI, the more capital is defending that strike.
OI Change — The Most Important Column
If you can only read one column in the option chain, read OI Change.
- Positive OI Change (Rising OI): New contracts being created = fresh money entering at this strike = conviction. Rising Call OI at resistance = fresh Call writing = institutions adding bearish bets at that resistance. Rising Put OI at support = fresh Put writing = institutions adding bullish bets at that support.
- Negative OI Change (Falling OI): Existing contracts being closed = conviction weakening. When Call OI at a resistance suddenly drops sharply (Call covering), that resistance is weakening — potential breakout above.
- Static OI: No change means existing positions are holding. Level remains significant but no new conviction is being added.
The most powerful option chain signal is a sudden large OI Change at a key level during market hours. If NIFTY approaches 25,200 and you see Put OI at that strike jump by 40,000+ in a 30-minute refresh — institutions are aggressively defending it in real time. High-conviction support. The reverse: if Call OI at 25,500 suddenly collapses — Call writers are covering, meaning they're no longer confident NIFTY will stay below that resistance. Watch for breakout above 25,500.
PCR — Calculating and Using Put-Call Ratio
PCR (Put-Call Ratio) = Sum of all Put OI across all strikes ÷ Sum of all Call OI across all strikes.
| PCR Value | Interpretation | Strategy Implication |
|---|---|---|
| Above 1.3 | Extreme bullish — too many Puts written | Strong buy CE environment, or contrarian PE on reversal |
| 1.1 – 1.3 | Bullish institutional bias | Prefer CE buying, bullish option selling |
| 0.9 – 1.1 | Neutral | Option selling, straddle/strangle |
| 0.7 – 0.9 | Bearish institutional bias | Prefer PE buying, bearish option selling |
| Below 0.7 | Extreme bearish — too many Calls written | Strong sell/PE environment, or contrarian CE on reversal |
PCR is most reliable when combined with the OI Change trend. PCR rising throughout the session (more Puts being written as the day progresses) = increasingly bullish bias being added in real time. PCR falling = Call writing increasing = bearish momentum building. Track the PCR direction, not just the current value.
Max Pain — The Expiry Day Magnet
Max Pain is the strike price at which the maximum number of options expire worthless — causing maximum financial loss for option buyers and maximum profit for sellers. Option sellers, who have the capital and motivation to defend their positions, actively buy or sell the underlying to push NIFTY toward Max Pain as expiry approaches.
How to Calculate Max Pain
For each strike, calculate the total in-the-money payout if NIFTY expires at that strike (sum of all Call ITM losses + all Put ITM losses for option buyers). The strike with the minimum total loss for option buyers = Max Pain. Most trading platforms and NSE's own tools display this automatically.
Practical rule: In the final 2 hours of expiry day, Max Pain exerts its strongest pull. If NIFTY is 200 points above Max Pain at 1:00 PM on expiry day, there's a higher-than-average probability of a drift downward toward Max Pain by 3:15 PM. Don't trade against Max Pain on expiry afternoon without very strong confirmation.
Max Pain works reliably on quiet expiry days but can be completely overridden by external events — RBI surprise, strong global cues, large FII activity. Never use Max Pain as your only expiry day input. Combine with live OI data, PCR trend, and India VIX level. On high-VIX expiry days, Max Pain mechanics are frequently overridden by directional pressure.
Implied Volatility in the Option Chain
Each strike in the option chain has its own IV. Understanding the IV pattern reveals important information:
- IV Smile: IV is typically lowest at ATM and rises for OTM strikes on both sides. This reflects the market's expectation that large moves are more possible than a normal distribution would suggest.
- IV Skew: When Put IV is significantly higher than equivalent Call IV, it signals fear — institutions are paying a premium to protect against downside. This is common before events and after market drops.
- Comparing IV to Historical Volatility: If NIFTY's 20-day historical volatility is 12% but ATM IV is 18%, options are expensive — sellers are better positioned. If IV is below historical volatility, options are cheap — buyers are better positioned.
Related: Option Buying vs Option Selling — Complete Guide
Option Chain Trading Strategies — Practical Applications
S/R Bounce — OI-Confirmed Entry
Identify the Max Put OI strike (support) pre-market. When NIFTY approaches this level and shows a bullish candle with increasing Put OI on refresh, buy CE. Stop-loss: below the Put OI support level. Target: resistance (Max Call OI strike). This is the most direct application of option chain data to intraday trading. ALGORAM processes this OI signal automatically for strategy entry.
Breakout Confirmation — OI Unwinding
When NIFTY approaches the Max Call OI resistance level, watch for Call OI Change to turn negative (Call writing covering). When large Call OI unwinds rapidly at resistance + NIFTY breaks above on volume = high-conviction breakout. The covering of short Call positions by institutions adds fuel to the upside move. Buy CE aggressively on this confirmation.
Range Identification — Straddle Setup
When Max Call OI and Max Put OI create a defined range (e.g., 25,000–25,500) + PCR is neutral (0.9–1.1) + VIX below 14, sell straddle at ATM. The option chain tells you the market expects NIFTY to stay in the range — your straddle profits from that expectation. Set stop if NIFTY breaks the range boundaries with strong OI Change acceleration.
Professional Intraday Option Chain Routine
- Pre-market (9:00–9:15 AM): Check overnight OI build. Note Max Put OI strike (support), Max Call OI strike (resistance), and PCR. Note Max Pain for expiry day context.
- Post-opening (9:30–10:00 AM): Refresh OI. Check where OI Change is positive — institutional writing confirming where they believe price should stay. Confirm PCR direction.
- Mid-session (every 30–45 minutes): Refresh and track OI Change trends. Is new Put OI being written at support (bullish)? Is Call OI unwinding at resistance (potential breakout)? Adjust directional bias accordingly.
- Pre-close (2:30–3:00 PM): On expiry day — track Max Pain. On regular days — look for OI covering (positions being closed) which often creates directional moves in the final hour.
Common Option Chain Reading Mistakes
- Reading morning OI all day. Option chain changes dramatically during the session. OI you read at 9:15 AM can be completely different by 11:30 AM. Refresh every 30–45 minutes minimum.
- Using absolute OI instead of OI Change. A strike with 50 lakh OI that hasn't changed since yesterday is less informative than a strike with 10 lakh OI that just added 3 lakh in the last 30 minutes (fresh conviction).
- Treating PCR as a one-time read. PCR that moves from 1.05 to 1.25 during the session means Put writing is accelerating — increasingly bullish. PCR moving from 1.1 to 0.85 means Call writing is increasing — bearish shift in progress. Direction of PCR movement matters as much as its current value.
- Ignoring liquidity (volume column). High OI at deep OTM strikes often has low volume — wide bid-ask spreads, poor execution. Only trade strikes with adequate volume (minimum 1,000 contracts/day for NIFTY).
- Over-relying on Max Pain on non-expiry days. Max Pain mechanics are most relevant in the final 2 hours of expiry day. Outside of that window, directional momentum and macro factors override Max Pain completely.
ALGORAM's OI Integration — Automated Option Chain Analysis
ALGORAM processes NSE option chain data in real time and integrates it directly into strategy entry logic. No manual OI reading required during the trading session:
- OI-confirmed entry: Strategy only enters when Put OI at configured support is above threshold AND OI Change is positive (fresh writing) — validating the level is actively defended
- PCR filter: Enter CE only when PCR exceeds 1.0; enter PE only when PCR is below 0.95 — automated directional bias filter
- OI unwind alert: Smart alert when significant OI unwinds at key levels — signals weakening of support/resistance for potential breakout trades
- Max Pain tracking: Displays current Max Pain level and NIFTY deviation on expiry day dashboard
Related: Price Action + Option Chain Analysis | NIFTY Options Buying Strategy
📊 Let ALGORAM Read Option Chain for You
OI confirmation, PCR filter, Max Pain tracking — all automated. Focus on strategy while ALGORAM monitors the chain in real time.
Special Offer — First 100 Customers
Conclusion
The option chain is not just a list of premiums — it's a real-time map of institutional positioning across every price level. When you read it correctly, you see where the informed money is defending, where it's abandoning its positions, and what range it expects the market to stay in. This is information most retail traders either ignore or misread.
The six key readings — OI at each strike, OI Change, PCR, IV level, Max Pain, and bid-ask spread — give you everything you need. Check it pre-market. Update it every 30–45 minutes during the session. Track OI Change more than absolute values. And let ALGORAM process it automatically for strategy entries so you never miss a signal while watching charts.
Frequently Asked Questions

Rahul spent 3 years specifically studying option chain OI patterns before building ALGORAM's OI integration engine. "The option chain is the closest thing Indian retail traders have to seeing institutional order flow in real time. Most traders ignore it because it looks complex. Once you understand 3 columns — OI Change, PCR, and strike selection — you have an edge the majority of the market doesn't use."