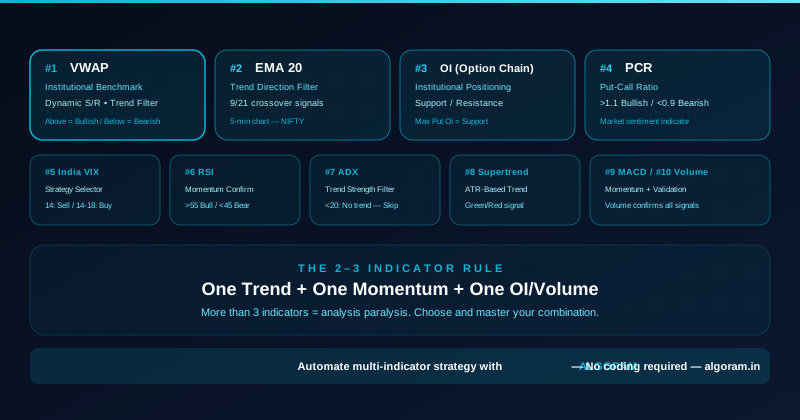
Why Indicators Matter — And Their Limits
Indicators are tools for processing market data into actionable signals. They convert raw price and volume information into a simplified format that helps traders identify trend direction, momentum, support/resistance, and market bias. Used correctly — with defined rules, proper combinations, and understanding of their limitations — they dramatically improve trade timing.
But indicators have a fundamental limitation: they are lagging by nature. They process past data to generate current signals. This means no indicator can perfectly predict the next move — they can only increase the probability of being on the right side. The goal is not 100% accuracy; it's consistently being on the right side more often than the wrong side, with proper risk management when wrong.
Professional traders use 2–3 indicators maximum. One trend indicator, one momentum indicator, one volume/OI indicator. More indicators create conflicting signals, hesitation, and missed opportunities. The worst charts are the ones with 8–10 indicators — they generate so much noise that the trader is paralysed. Choose 2–3 from different categories and master them.
Indicator Categories for Intraday Trading
| Category | What It Measures | Best Indicators | Use For |
|---|---|---|---|
| Trend | Direction of price movement | VWAP, EMA, Supertrend | Trade in right direction |
| Momentum | Speed and strength of move | RSI, MACD, Stochastic | Confirm entry timing |
| Volume | Participation at price levels | Volume, OBV | Validate breakouts |
| Volatility | Range and uncertainty | Bollinger Bands, ATR, VIX | Adjust position size |
| Trend Strength | How strong is the trend? | ADX | Filter choppy days |
| OI / Sentiment | Institutional positioning | Option Chain OI, PCR, Max Pain | Identify key S/R, bias |
Top 15 Intraday Trading Indicators — Ranked
VWAP calculates the cumulative average price weighted by volume since market open. It resets every day. Institutions execute large orders targeting VWAP — making it the most reliable intraday support/resistance. Above VWAP = institutional buying pressure dominates. Below VWAP = selling pressure. The VWAP pullback entry is arguably the highest-probability intraday setup available in Indian markets.
EMA 20 on the 5-minute chart provides a dynamic trend filter for intraday trading. Price above EMA 20 = bullish trend, only take long setups. Below EMA 20 = bearish, only take shorts. EMA reacts faster to recent prices than SMA — giving earlier trend change signals. Combine with EMA 9 for crossover signals: when EMA 9 crosses above EMA 20 with rising volume, it confirms bullish momentum. Related: Best Intraday Strategies for Beginners
The option chain's OI data is India's most unique and powerful intraday tool — not available in most other markets. Maximum Put OI strike = the level institutional Put writers (institutions with bullish bias) will defend — strong support. Maximum Call OI strike = institutional Call writers will defend it — strong resistance. When OI at a strike is increasing, new money is entering. When decreasing, positions are being covered. This is real institutional positioning data — not an algorithm, not a formula, but actual money at actual levels. Related: Option Chain S/R Analysis Guide
PCR = Total Put OI ÷ Total Call OI. Above 1.1: more Puts written than Calls = institutions are bullish (Put writers only write Puts if they think the market won't fall to those strikes). Below 0.9: more Calls written = bearish institutional bias. Between 0.9–1.1: neutral market — ideal for option selling. PCR is contrarian: it shows what the smart (option-writing) money believes, not the retail (option-buying) crowd. The crowd is usually wrong at extremes.
India VIX measures the implied volatility of NIFTY 50 options — the market's expectation of how much NIFTY will move over the next 30 days. More than just a fear gauge, VIX is a strategy selector: below 14 = sell options (premiums are cheap but movement is low), 14–18 = buy options with strong setups, above 18 = reduce position size (large moves likely in either direction). When VIX spikes above 20, even well-planned trades get stopped by unusual volatility. This is when professional algo systems reduce capital exposure automatically.
RSI (14-period default) measures momentum — how quickly price is moving and whether it's overbought or oversold. For intraday trading, use RSI as a confirmation tool rather than a signal generator. Rule: only take CE/long positions when RSI is above 55 and rising; only take PE/short positions when RSI is below 45 and falling. Avoid RSI 45–55 zone — momentum is ambiguous. Warning: never fade an RSI extreme in a strong trend. NIFTY can stay at RSI 75–80 for hours during a bull run.
ADX measures how strong a trend is — not its direction. This makes it invaluable as a filter: if ADX is below 20, NIFTY is in a choppy, trendless phase and trend-following strategies (ORB, EMA crossover, VWAP continuation) will fail repeatedly. Wait. If ADX is between 20–40, trend strategies are likely to work. Above 40 means an exceptionally strong trend where even pullback strategies should follow the trend. Check ADX before taking any intraday setup — it determines whether your strategy has an appropriate environment.
Supertrend plots a line above price (red/bearish) or below price (green/bullish) based on ATR and a multiplier. When it flips from red to green, it signals a bullish trend reversal. Green to red = bearish reversal. Best settings for NIFTY intraday: ATR period 10, multiplier 3.0 on the 15-minute chart. Avoid 1-min and 3-min charts — too many false flips. Use Supertrend to confirm your VWAP or EMA signal, not as standalone. When both VWAP and Supertrend agree on direction, the probability of a successful trade increases significantly.
MACD combines trend and momentum: the MACD line (EMA 12 minus EMA 26) crossing above the Signal line (EMA 9 of MACD) is bullish. Crossing below is bearish. For intraday, use MACD on the 15-minute chart as a trend confirmation tool. The histogram shows momentum — expanding green bars = accelerating bullish momentum, expanding red bars = accelerating bearish momentum. MACD is more useful for confirming trend direction than for precise entry timing — use VWAP or EMA for that.
Volume is the most underrated and underused indicator in Indian retail trading. Every signal is stronger when accompanied by above-average volume — every signal is weaker or suspect without it. ORB breakout with 3x volume = high conviction. ORB breakout with 0.7x volume = false signal, don't trade it. VWAP bounce with declining volume = weak, skip it. Rising price with declining volume = distribution, watch for reversal. Volume is not a standalone indicator; it's the truth-teller for every other indicator you use. Always ask: is volume confirming this signal?
Bollinger Bands plot a middle band (EMA 20) with upper and lower bands at 2 standard deviations. When bands narrow (squeeze), a breakout is imminent — direction unknown. When bands expand, trend is active. Price touching upper band in uptrend = strength (not automatically overbought in a trending market). Price touching lower band in downtrend = continuation. Most useful for identifying consolidation periods where ORB and momentum strategies are not appropriate.
Stochastic (14,3,3) compares the closing price to the high-low range over the lookback period. Above 80 = potentially overbought. Below 20 = potentially oversold. For intraday, useful for identifying short-term exhaustion — particularly the %K crossing above %D in oversold territory (bullish reversal) or below %D in overbought territory (bearish reversal). Works best in sideways markets where RSI struggles. In trending markets, let Stochastic stay in overbought/oversold zones and don't fade the trend.
ATR measures the average daily trading range over the lookback period (14 default). Critical use for intraday: stop-loss calibration. Instead of a fixed-percentage stop, an ATR-based stop adjusts for current market volatility. On a high-ATR day, give trades more room. On a low-ATR day, tighter stops are appropriate. ALGORAM uses ATR-based stop-losses as an option in its position configuration — adapting automatically to volatility rather than using rigid percentage stops that get triggered by normal intraday noise on volatile days.
Foreign Institutional Investor (FII) and Domestic Institutional Investor (DII) daily net buy/sell data from NSE is not a chart indicator — but it's one of the most reliable macro directional inputs for NIFTY intraday trading. When FIIs are net buyers for 3+ consecutive sessions, NIFTY tends to find support on dips. When FIIs turn aggressive sellers, even technically strong support levels get breached. Check FII/DII data on NSE India's website before market open. FII net buyer + PCR above 1.1 = strongly bullish environment for CE buying. Related: How FIIs and DIIs Affect NIFTY
Max Pain is the price level at which the maximum number of option contracts (both CE and PE) would expire worthless — resulting in maximum loss for option buyers and maximum gain for sellers. On or near expiry day, NIFTY has a strong gravitational pull toward the Max Pain level as option sellers defend their positions. This makes Max Pain the single most important level on expiry day. Calculate it from the option chain (sum of OI × distance from each strike — the level with minimum total pain for sellers). NIFTY typically hovers within ±150 points of Max Pain on expiry day. Related: Reading Option Chain Professionally
Best Indicator Combinations — Proven Setups
The cleanest beginner combination. VWAP provides directional bias (above/below). EMA 20 confirms the trend on 5-min chart. Volume validates the signal. Rule: only enter long when price is above VWAP AND above EMA 20 AND volume is above 20-period average. All three must agree. This reduces false signals dramatically while keeping the setup simple enough to execute quickly. Best applied to NIFTY options buying — CE when all three are bullish, PE when all three are bearish.
The professional NIFTY trader combination. VWAP gives direction. Option Chain OI identifies the exact support/resistance the market is defending. PCR confirms the overall institutional bias. ADX filters out choppy sessions. Enter CE only when: VWAP is bullish + high Put OI at nearby support (below price) + PCR above 1.0 + ADX above 20. This is ALGORAM's default NIFTY OI-confirmed strategy configuration — all four checked automatically before each entry.
Designed for option selling environments. VIX below 14 confirms premium levels are stable. PCR between 0.9–1.1 confirms neutral market (no strong directional move expected). Supertrend flat confirms no emerging trend. Bollinger Bands narrow (squeeze) confirms low volatility consolidation. When all four align, sell the strangle at the Bollinger upper and lower bands. This is the highest-conviction option selling setup — four independent confirmations that the market is in a stable, premium-selling environment.
For momentum traders who prefer chart-based setups over OI analysis. EMA 9 crosses above EMA 21 (5-min chart) = bullish. Confirm with RSI above 55 and MACD histogram expanding green. Volume above average validates the breakout is real, not noise. The four-factor confluence makes this one of the highest-probability pure-chart setups. Best on trending days (check ADX above 20 before applying). Avoid on sideways, low-ADX sessions.
Common Indicator Mistakes — What Not to Do
- Using more than 3 indicators simultaneously. Seven conflicting signals create paralysis. Pick your combination, stick to it, measure results.
- Treating indicators as crystal balls. Every indicator generates false signals. The goal is a combination that's right more often than wrong — not one that's right every time.
- Ignoring the timeframe. Supertrend is useful on 15-min charts and nearly useless on 1-min charts. RSI divergence matters on 5-min charts, not 1-min. Use the right timeframe for each indicator.
- Not combining with volume. Any breakout without above-average volume is suspect. Volume costs nothing to add to every indicator combination.
- Forgetting India VIX. Every intraday session should begin with a VIX check. It determines which strategy type is appropriate for the day — before you look at a single chart.
Automate Indicator-Based Strategies with ALGORAM
All 15 indicators in this guide can be incorporated into automated trading rules on ALGORAM — no programming required. Configure multi-indicator entry conditions through the visual strategy builder:
- VWAP: above or below entry condition
- EMA crossover: 9/21 on 5-min chart
- RSI threshold: above 55 or below 45
- OI from option chain: Put OI at support, Call OI at resistance
- PCR threshold: above 1.0 or below 0.9
- India VIX threshold: capital protection mode above configured level
- Supertrend direction: green or red
- ADX filter: minimum ADX value before trade activation
Configure a combination once — ALGORAM checks all conditions simultaneously and executes in under 50ms when they're all met. No need to monitor multiple indicators manually. Related: How to Start Algo Trading in India | No-Code Algo Trading for Beginners
📈 Automate Your Indicator Strategy
VWAP + OI + RSI + ADX — configure multi-indicator entry logic without coding. 7-day free paper trading on real NSE data.
Special Offer — First 100 Customers
Conclusion
The best indicator for intraday trading is not any single tool — it's the right combination of 2–3 indicators from different categories, applied to the appropriate market regime, confirmed by volume, and filtered by India VIX and ADX. VWAP is your foundation. Option Chain OI is your institutional edge. RSI or MACD is your momentum confirmation. VIX is your strategy selector.
Start with Combination 1 (VWAP + EMA 20 + Volume) if you're a beginner. Master it over 30 days of paper trading. Measure your win rate and risk-reward. Only when this combination is performing consistently should you consider adding OI-based layers. Complexity is not an advantage in intraday trading — clarity is.
Frequently Asked Questions

After testing dozens of indicator combinations over 8 years of manual trading, Ankit settled on VWAP + OI + PCR + ADX as his core framework before building ALGORAM. "The traders who fail with indicators almost always use too many. Two well-chosen indicators that you understand completely will outperform ten that you sort of understand."