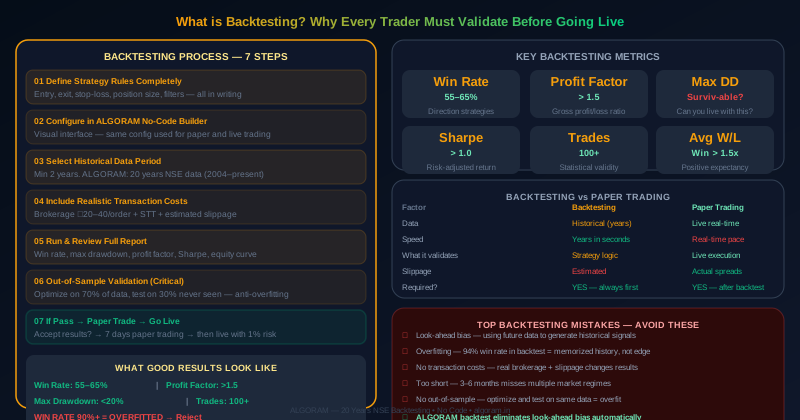
What is Backtesting in Trading?
Imagine you've developed a trading strategy — buy NIFTY CE when the 15-minute candle breaks the opening range high with volume above 2x average, stop-loss at 35% of premium, target at 1.5x risk. Before risking a single rupee, you have one crucial question: does this strategy actually work?
Backtesting answers that question. It's the process of running your strategy's rules against historical market data — months or years of past NIFTY price data — and recording every simulated trade outcome. The result tells you: how often it won, how much it made on winners, how much it lost on losers, and what the worst losing streak looked like.
Backtesting doesn't guarantee future performance. Markets evolve. But it does something essential: it eliminates strategies that have no historical edge. A strategy that fails on 5 years of historical data will almost certainly fail in live markets. And a strategy that passes rigorous backtesting has a reasonable probability of being viable — provided you apply sound risk management.
Why Backtesting Matters More Than Most Traders Realise
Most retail traders in India start with a trading idea, apply it to 3–5 recent chart examples where it "looks good," and then deploy it with real capital. This is the equivalent of testing a drug on 3 patients and declaring it safe for 3 crore people.
Markets have regimes: trending periods, sideways periods, high-volatility crisis periods, low-volatility grinding periods. Any strategy can look good in one regime. The question is whether it survives across all of them. Without backtesting on sufficient data:
- You don't know what the worst losing streak looks like — and whether you can psychologically or financially survive it
- You don't know the realistic win rate — vs the optimistic rate you imagine from 5 cherry-picked examples
- You don't know if the strategy has positive expectancy — or just looks profitable because you've unconsciously selected winning examples
Related: Can You Make Money with Algo Trading? | Why 90% of Traders Lose Money
How Backtesting Works — The Core Process
Backtesting works by simulating your strategy's rules against historical price data, treating each historical bar as if it were happening in real time — without looking ahead at future data. For each historical trading session:
- Your entry conditions are evaluated against price, volume, and indicator data
- When conditions are met, a simulated trade entry is recorded at that bar's close (or open, depending on configuration)
- From entry, the system tracks whether stop-loss or target is hit first
- The trade outcome (profit or loss) is recorded
- This repeats across thousands of historical bars
The output is a complete trade log with every simulated entry and exit — typically spanning hundreds or thousands of trades. From this log, all key performance metrics are calculated.
Step-by-Step: How to Backtest a Trading Strategy on ALGORAM
Define Your Complete Strategy Rules
Before touching the backtesting tool, write out every rule: which instrument (NIFTY 50, Bank Nifty, weekly/monthly), entry conditions (price, indicator, volume, OI conditions), stop-loss type (fixed %, ATR-based, level-based), target (R:R or % target), position size (% of capital), time-based exits, and any filters (VIX level, time of day, day of week).
Configure in ALGORAM's No-Code Builder
Enter your rules through ALGORAM's visual strategy builder — no coding required. Select instrument, timeframe, entry conditions through dropdown logic, set stop-loss and target parameters, and configure risk rules. The same configuration is used for backtesting and live deployment — no rebuilding.
Select Historical Data Period
Choose minimum 2 years for intraday strategies, 5+ years for options strategies. ALGORAM provides 20 years of NSE historical data. Include major market events in your test period: 2020 COVID crash, 2022 rate-hike volatility, the 2023 bull run — your strategy should demonstrate robustness across all.
Include Realistic Transaction Costs
Always include brokerage (₹20–40 per order), STT, exchange transaction charges, and estimated slippage. At 2 trades per day over 250 trading days = 500 trades per year. Transaction costs alone can consume 2–4% of capital annually. A strategy that looks profitable before costs may be marginal after — backtesting must include these.
Run and Review the Full Report
ALGORAM generates a comprehensive backtesting report including: equity curve, monthly P&L breakdown, win rate, max drawdown, profit factor, Sharpe ratio, and the full trade log. Review every metric carefully.
Out-of-Sample Validation
This is the most important step most traders skip. Split your historical data: optimize your strategy parameters on 70% of the data, then test the optimized strategy on the remaining 30% that the optimization never saw. If performance drops dramatically on the unseen 30%, the strategy is overfitted.
Accept or Reject — Then Paper Trade
If backtesting results are acceptable (win rate viable, max drawdown survivable, positive expectancy), proceed to paper trading. If not, revise the strategy — adjust entry conditions, stops, or filters — and repeat the backtest. Never skip directly from backtesting to live trading. See: How to Start Algo Trading in India
Key Backtesting Metrics — What to Look For
Backtesting vs Paper Trading — Why You Need Both
| Factor | Backtesting | Paper Trading |
|---|---|---|
| Data | Historical — years of data in minutes | Live — real-time market data |
| Speed | Tests 5 years in seconds | Real time — days or weeks |
| Capital at Risk | None | None (virtual) |
| What it validates | Strategy logic and edge | Live execution, spreads, slippage |
| Slippage | Estimated — may not reflect reality | Actual bid-ask spreads and fills |
| Market regime coverage | Excellent — covers all historical regimes | Limited to current conditions |
| When to use | Before paper trading | After backtesting passes |
| Can it replace the other? | No — paper trading also required | No — backtesting also required |
The correct sequence: Backtest → Paper Trade → Live. Skipping either step increases the probability of unexpected losses in live markets.
Common Backtesting Mistakes
- Look-ahead bias: Using future data to generate historical signals. Example: using the closing price to generate a signal that supposedly triggered at the opening. The most common and most damaging backtesting error.
- Overfitting: Optimising parameters until the strategy looks perfect on historical data. A strategy that shows 94% win rate was probably overfit. Always validate on out-of-sample data.
- Ignoring transaction costs: Testing without brokerage, STT, and slippage overstates profitability significantly — especially for high-frequency strategies.
- Too short a test period: 3–6 months may show only a bull run or only a sideways market. 2+ years is the minimum — 5+ years is strongly recommended.
- Survivor bias: Testing options strategies only on currently liquid strikes. Some options that existed 5 years ago are now illiquid or expired — this can skew historical results.
Understanding Overfitting — The Silent Killer
Overfitting is what happens when you tune your strategy's parameters — RSI period, moving average length, stop-loss percentage — specifically to the historical data you're testing on. The strategy essentially learns the specific history rather than a generalizable pattern.
Signs of overfitting:
- Win rate above 85% on historical data — almost certainly overfit
- Performance drops dramatically (more than 30%) on out-of-sample data
- The strategy has many parameters (5+) each optimized individually
- The strategy "breaks" when you change the test period slightly
Keep your strategy simple — 2–3 conditions maximum. Avoid optimising more than 1–2 parameters. Use out-of-sample testing (70% optimize, 30% validate). Accept that live performance will be somewhat lower than backtested performance — a 5–10% reduction is normal. A 30%+ reduction is a sign of overfitting.
What Good Backtesting Results Look Like
Here's a realistic example of a well-performing NIFTY ORB strategy backtest over 3 years (750 trading sessions, ~450 trade signals):
| Metric | Result | Assessment |
|---|---|---|
| Win Rate | 58% | Solid for directional strategy |
| Average Win | ₹3,200 | 2x average loss |
| Average Loss | ₹1,600 | Well-contained |
| Profit Factor | 1.76 | Good — above 1.5 |
| Max Drawdown | 12.4% | Acceptable — survivable |
| Sharpe Ratio | 1.38 | Above 1.0 — acceptable |
| Worst Streak | 7 consecutive losses | At 1% risk = 7% drawdown |
| Total Trades | 450 | Statistically meaningful |
This isn't a perfect strategy — 58% win rate, 12% drawdown, 7-loss streak. But it has a clear edge, survivable drawdown, and enough trades for statistical confidence. This is what real profitable strategies look like. Not 90% win rates and zero drawdowns.
How ALGORAM's Backtesting Engine Works
ALGORAM provides one of India's most comprehensive retail backtesting environments:
- 20 years of NSE data — NIFTY, Bank Nifty, Nifty Midcap, and F&O data back to 2004
- No-code configuration — the same strategy you configure for backtesting runs live in paper trading and live mode — no rebuilding
- Options backtesting — including historical options premium data, IV levels, and option chain snapshots
- Transaction cost model — brokerage, STT, and slippage settings built in
- Full report output — equity curve, monthly breakdown, trade log, all key metrics
- Out-of-sample mode — split-period testing built into the platform
Related: Can You Make Money with Algo Trading? | Top 10 Algo Trading Strategies
📊 Validate Your Strategy Before Going Live
Test your strategy on 20 years of NSE data — free for 7 days. See exactly how it performs before risking any capital.
🚀 Launch Offer — First 100 Customers
Conclusion
Backtesting is not optional — it's the foundation of every professional trading system. It's the single most important step between having a trading idea and deploying real capital. Strategies that skip backtesting either get lucky (temporarily) or lose money (usually quickly).
The correct approach: define your strategy completely, backtest on 2+ years of NSE data with realistic transaction costs, validate on out-of-sample data, check that results meet your criteria (win rate, drawdown, profit factor), then paper trade before going live. Every step matters. None can be skipped without increasing the probability of avoidable losses.
ALGORAM makes this entire process available in one platform — no coding, no data sourcing, no separate tools. The same strategy configuration flows from backtesting → paper trading → live execution. Build it once. Test it thoroughly. Deploy it confidently.
Frequently Asked Questions

Rahul built ALGORAM's backtesting engine from the ground up on 20 years of NSE data. His philosophy: "Every hour you spend backtesting is worth 10 hours of emotional live trading experience. You learn what works and what doesn't without losing capital in the process." He's personally backtested hundreds of strategies and deployed only those that passed rigorous out-of-sample validation.