What is a Breakout?
A breakout is a price move beyond an established support or resistance level — a level the market has previously respected. When NIFTY has bounced off 25,200 three times and finally pushes above it, that's a breakout of resistance. When Bank Nifty has held 51,000 for a week and drops below it, that's a breakdown of support.
The theory is simple: levels represent zones where supply and demand previously balanced. When price finally moves beyond them, the balance has shifted — and price should continue in the breakout direction as trapped positions unwind and new momentum traders join.
The problem: the theory only works when the breakout is real. And in Indian intraday markets, the majority of level breaches are not real breakouts — they're noise, stop hunts, or low-conviction pokes that reverse within minutes. Trading every breach loses money. Trading only confirmed breakouts is one of the most reliable strategies in existence. This guide teaches you the difference.
Types of Breakouts
- Horizontal level breakout: Beyond a flat support/resistance (previous day high/low, weekly high/low, round numbers like 25,000)
- Range breakout: Beyond a multi-day consolidation range — the longer the range, the more powerful the eventual breakout
- Opening Range Breakout (ORB): Beyond the first 15-minute high/low — the classic intraday setup (full ORB guide here)
- Trendline breakout: Beyond a rising or falling trendline — signals trend change
- Pattern breakout: From triangles, flags, head-and-shoulders necklines
Why Most Breakouts Fail
Studies of intraday price behaviour consistently show that 60–70% of intraday level breaches reverse rather than continue. Three structural reasons:
- Liquidity clusters at obvious levels. Every retail trader watching NIFTY sees the same previous-day high. Stop-losses of short sellers and breakout buy orders both cluster just above it. Large players know this — pushing price through the level triggers a burst of forced orders they can sell into. Price breaches, orders trigger, institutions fill their positions, price reverses. This is a liquidity grab (stop hunt), and it's a feature of markets, not a bug.
- Low-volume breaches have no fuel. A breakout needs new money to sustain the move beyond the level. If the breach happens on below-average volume, only small retail orders are pushing — and the first wave of profit-taking sends price straight back into the range.
- Breakouts against the higher-timeframe trend rarely stick. A 5-minute breakout above resistance while the hourly chart is in a clear downtrend is swimming against the institutional tide. The hourly sellers use the pop as a better entry to short.
The Psychology of the Trap — Why Retail Traders Get Caught
False breakouts work precisely because of how human psychology responds to price movement:
- FOMO at the breach: Watching price push above a level you've been staring at for an hour creates an overwhelming urge to enter now before "missing the move." That urgency is exactly what makes traders enter on the wick — before any confirmation exists.
- Confirmation bias: Once you want the breakout to be real, every tick higher feels like proof. You ignore the falling volume and the Call writers adding OI at the strike above.
- The double trap: After being caught in a false breakout, the trader hesitates on the next one — which turns out to be real. Now they've lost on the fake AND missed the genuine move. This whipsaw destroys both capital and confidence.
The solution isn't better instincts — it's a mechanical filter stack that removes the decision from the moment of emotion. That's what the five filters below provide. Related: Trading Psychology — Control Fear, Greed & FOMO
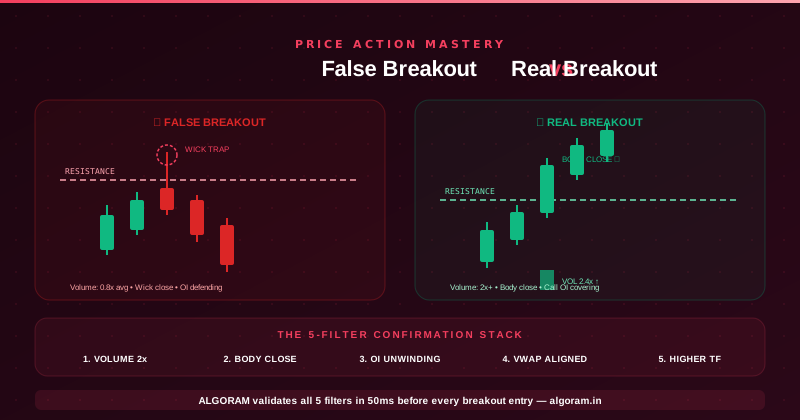
False vs Real Breakout — Side by Side
| Signal | Real Breakout | False Breakout |
|---|---|---|
| Volume on breakout candle | 2x+ the 20-period average | At or below average |
| Candle close | Strong close beyond level (body, not wick) | Long wick beyond, close back inside |
| Call OI at broken resistance | Decreasing (writers covering) | Increasing (writers defending) |
| Retest behaviour | Level holds as new support | Price slices back through level |
| Higher timeframe (15-min/hourly) | Agrees with breakout direction | Contradicts the move |
| VWAP position | Price on breakout side of VWAP | Price fighting against VWAP |
| Follow-through candles | Next 2–3 candles continue direction | Immediate reversal candle |
| Time of day | 9:30–11:00 AM (high participation) | 12:00–1:30 PM (lunch chop) |
Filter 1 — Volume Confirmation (The Non-Negotiable)
Volume is participation made visible. A genuine breakout means institutions are committing capital beyond the level — and institutional orders are large enough to show up unmistakably in volume. The rule: the breakout candle's volume must be at least 2x the 20-period average volume. Below that, the breach is retail noise. This single filter alone eliminates roughly half of all false breakouts. Also watch the volume trend: rising volume into the level (accumulation before the break) is even stronger than a single volume spike.
Filter 2 — Closing Confirmation (Kill the Wick Trap)
The single most common breakout error is entering the moment price ticks beyond the level — mid-candle. Stop hunts are designed to trigger exactly these entries: price spikes 20 points above resistance, fills the waiting orders, and closes back below. The wick is the trap. The rule: enter only after a 5-minute candle closes with its body beyond the level. Yes, you sacrifice a slightly worse entry price. In exchange, you skip the majority of stop hunts. For higher conviction, wait for the close AND the next candle to hold above the level.
Filter 3 — Open Interest & Option Chain Confirmation (India's Edge)
This is the filter most retail traders don't use — and it's the most powerful one available in Indian markets. When NIFTY approaches resistance at 25,500 where heavy Call OI sits, watch the OI Change in real time. If Call OI at 25,500 starts decreasing sharply as price pushes through — Call writers are covering their shorts. They no longer believe the level holds. Their buying-to-cover adds fuel to the breakout. That's a real breakout signature. If Call OI keeps increasing as price breaches — writers are defending with fresh conviction, and the breakout will very likely fail. Same logic inverted for support breakdowns and Put OI. Full guide: How to Read Option Chain
Filter 4 — VWAP & EMA Alignment
An upside breakout with price above VWAP means institutional flow already supports the direction — the breakout extends an existing bias. An upside breakout with price below VWAP is fighting institutional selling pressure and fails far more often. Add EMA structure: EMA 9 above EMA 21 on the 5-minute chart confirms momentum alignment. ATR adds context — a breakout after a period of contracting ATR (tight range) has more explosive potential than one during already-extended volatility.
Filter 5 — Multi-Timeframe Check
Enter on the 5-minute, confirm on the 15-minute. If the 15-minute chart shows a clear downtrend (lower highs, price below EMA 20), a 5-minute upside breakout is a countertrend trade — skip it or halve the size. For positional breakout trades, the daily chart holds veto power over the hourly. The strongest breakouts occur when all three timeframes point the same way: daily uptrend + hourly consolidation + 5-minute breakout. That alignment is where the biggest moves begin.
Entry, Stop-Loss & Target Rules
- Entry: After the 5-min candle closes beyond the level with volume — not on the breach itself. Aggressive variant: enter on the retest of the broken level (better price, slightly lower fill probability).
- Stop-loss: Just inside the broken level with a small noise buffer. Resistance broken at 25,200 → stop at 25,150–25,170. Hard rule: if any candle closes back inside the range, exit immediately regardless of where your stop sits — the breakout has failed.
- Target 1: The measured move — the height of the prior range projected from the breakout point. Range of 150 points → first target 150 points beyond the level.
- Target 2: The next OI-based level (next major Call OI strike for upside moves).
- Position size: Risk stays capped at 1% of capital per trade — the stop distance determines quantity, never the reverse. Full framework: Risk Management Guide
- Time rule: Intraday breakout not moving in your favour within 30–40 minutes → exit flat. Real breakouts move quickly; stalling is failure in slow motion.
Case Study — NIFTY: Anatomy of Both Breakouts in One Session
NIFTY consolidates all morning between 25,080 and 25,180. At 11:15 AM, price pokes to 25,196 — 16 points above resistance. Volume on the breach candle: 0.8x average. Call OI at 25,200: rising. The candle closes at 25,168 — back inside the range with a long upper wick. Every breakout buyer who entered on the poke is trapped; price grinds down to 25,110 over the next hour, stopping them all out.
At 1:45 PM, price approaches 25,180 again. This time: volume builds to 2.4x average on the approach, Call OI at 25,200 drops by 1.8 lakh contracts in 30 minutes (writers covering), and the 15-minute chart has printed a higher low. The 1:50 PM candle closes at 25,214 — body above the level. Entry at 25,215, stop at 25,165. NIFTY runs to 25,320 by 3:00 PM. Same level, same day — the filters told you which breach to skip and which to take.
Case Study — Bank Nifty: The Expiry Day Stop Hunt
Expiry Thursday. Bank Nifty holds 51,000 all morning — the strike with the day's maximum Put OI. At 12:40 PM, in the lunch-hour volume vacuum, price drops to 50,940. Breakdown? Check the filters: volume 0.6x average, Put OI at 51,000 still increasing (writers defending, not covering), price 60 points below VWAP but the 15-minute chart still shows higher lows.
Three of five filters say fake. Within 20 minutes, BN reclaims 51,000 and squeezes to 51,380 by close as the trapped PE buyers cover — the classic expiry-day pull toward Max Pain. The traders who shorted the "breakdown" funded that squeeze. Full expiry mechanics: Bank Nifty Algo Strategy
The Professional Breakout Checklist
One point each. 4+/6 = tradeable. 3 or below = skip.
- Volume on breakout candle ≥ 2x average?
- Candle CLOSED beyond the level (body, not wick)?
- OI unwinding at the broken level (writers covering)?
- Price on the breakout side of VWAP?
- 15-minute timeframe agrees with the direction?
- Time window is 9:30–11:00 AM or 1:45–2:45 PM (not lunch chop)?
Common Breakout Trading Mistakes
- Entering on the breach instead of the close. The wick is the trap. Wait for the close — always.
- Ignoring volume because "the level was so important." Level significance without volume is a stop-hunt magnet, not a signal.
- Trading lunch-hour breakouts. 12:00–1:30 PM breaches are noise in a volume vacuum. Skip the window entirely.
- Re-entering immediately after being stopped. A failed breakout is information — the level is being defended. Revenge re-entry doubles the loss.
- Widening the stop when the breakout stalls. A stalling breakout is a failing breakout. The stop exists precisely for this moment.
- Skipping the next setup after one fake. The whipsaw trap: burned on the fake, absent for the real one. A mechanical checklist — or automation — is the only cure.
How ALGORAM Filters False Breakouts Automatically
Everything in this guide can be encoded as rules — and rules can be automated. ALGORAM's breakout strategies validate the full confirmation stack before any entry, in under 50ms:
- Close-based triggers: Entries fire only on candle close beyond the level — never on intra-candle wicks
- Volume gate: Configurable multiplier (default 2x average) — breach without volume is ignored silently
- OI confirmation: Real-time option chain processing — entry blocked if OI at the broken strike is building against the move
- VWAP + EMA alignment filters: Directional bias must agree before the trigger arms
- Time-window restriction: Strategy stays dormant during 9:15–9:30 AM and the 12:00–1:30 PM chop
- Disciplined exits: Stop just inside the level, auto-exit on close back inside the range, hard 3:10 PM square-off
The result: the platform takes every qualified breakout and skips every unqualified one — with zero FOMO, zero hesitation, and zero whipsaw psychology. Related: How to Start Algo Trading in India
🛡️ Stop Getting Trapped by False Breakouts
Volume + Close + OI + VWAP + Timeframe — all five filters validated in 50ms before every entry. 7-day free paper trading on real NSE data.
Special Offer — First 100 Customers
Conclusion
The breakout itself is not the signal — the confirmation is. A level breach on low volume with writers defending and a wick close is a trap by design. The same breach with 2x volume, OI covering, a body close, and timeframe alignment is one of the highest-probability entries in trading. The market gives you both, often at the same level in the same session. The five-filter checklist is what separates the trades you take from the traps you skip.
Score every breakout before entering: 4 out of 6 or skip it. Better yet, encode the rules and let them execute without you — because the checklist only works if it's applied every single time, including the times FOMO screams the loudest.
Frequently Asked Questions

Rahul spent years studying why identical-looking breakouts produce opposite results before encoding the answer into ALGORAM's confirmation engine. "The level breach is the question, not the answer. Volume and OI are the answer. Once I stopped trading breaches and started trading confirmations, my breakout win rate went from a coin flip to a genuine edge."